The Safety Stock Calculation Formula
 by Don Lindsey
Determining the most efficient inventory levels is one of the most important components of your company’s operations.
Safety stock describes a level of extra inventory that your company maintains to mitigate the risk of stockouts or shortfalls in the raw materials due to uncertainties in the supply and demand. When your safety stock levels are adequate, your business operations can proceed according to plan. When they aren’t, you could be tying up cash flow or threaten your ability to adequately serve your customers. So, mastering the art of safety stock is certainly your guard against uncertainty.
When I think of Safety Stock, the old acronym CYA comes to mind. Or, more appropriately, CYAWBH (CYA with both hands).
The Formula
Having adequate materials on hand to minimize risk requires an understanding of how inventory flows through your facility along with a little of the mathematics behind the concept of safety stock.
The Safety Stock calculation is:
SS = K * MAD ADJ LT
SS = Safety Stock, K = Desired Service Level, MAD = Mean Absolute Deviation of Forecast to Actual Demand, LT = Lead Time
What You’ll Need to Record in ERP
First, you need to identify individual items that require forecasting because they are subject to variation in demand. To make that determination, let’s first review dependent vs. independent demand items.
Dependent vs. independent demand
Independent demand items are those items in your inventory that you “sell” and, because of that, are subject to variability in demand. Dependent demand items are items that are required to produce an assembly. This type of demand is based on the Bill of Materials relationships in your assembled product.
Once you have identified which items require forecasting (independent demand items), you need to devote a field in your ERP database to indicate that items are forecastable. In QAD ERP, you could use the Master Schedule field [pt_mstr – pt_mstr] in the 1.4.1 Item Master Maintenance menu, the 1.4.7 Item Planning Maintenance menu or 1.4.17 Item-Site Planning Maintenance menu. Adding this field will allow you to track activities in your ERP system related to Safety Stock.
The calculation of Safety Stock starts with a determination of what the historical accuracy of the forecast has been. That means you need a mechanism to capture the forecasting on a monthly or another periodic basis along with the actual sales that took place against that forecast. Many companies use a spreadsheet-based process for this, but for more control and better accuracy, I advise companies to use the data fields in their ERP System. In QAD, use the 22.7 Forecast Simulation menu.
Applying MAD
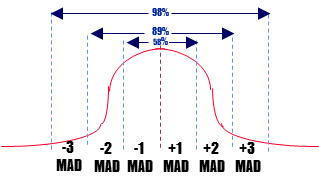
To calculate the MAD or Mean Absolute Deviation, compare the historical forecast to the actual sales by period.
Then, take the average absolute deviation and plot it against the mean to arrive at a probability curve which would indicate the chance that an occurrence of demand would fall within the bell curve around the average.
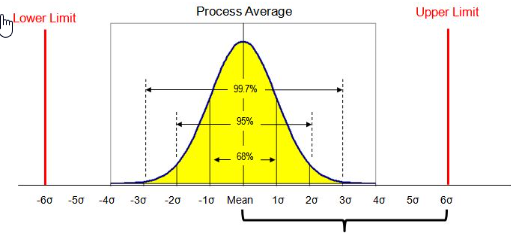
This is a more straightforward calculation than the Standard Deviation of Demand as represented by the formula and graph.

Applying Service Level
Once you understand the variation in demand, you can look at the desired service level. The desired service level is based on what your management would like to guarantee to your customer and is typically expressed as a percentage of orders filled.
This following data matrix shows the relationship between the Inventory required to meet a predetermined service level and the inventory needed to ensure that level.
ASSUME:
 SERVICE    SAFETY       X MAD
 LEVEL      FACTOR       = 22
--------   --------     --------
  50%        0.00         0.00
  75%        0.84        18.48
  80%        1.05        23.10
  85%        1.30        28.60
  90%        1.60        35.20
  95%        2.06        45.32
  98%        2.56        56.32
  99%        2.91        64.02
Applying Lead Time
Lead time is the last element of the Safety Stock calculation. It is optimal to have the Planner and Buyers take responsibility for updating the MOST accurate lead time possible in the ERP database. In QAD, this would require updates to the 1.4.7 Item Planning Maintenance and/or the 1.4.17 Item-Site Planning Maintenance menus.
One of the best ways to estimate your lead time is to compare the lead time in the Item Master Planning field to the release date for Purchase and/or the Work Order to the receipt date. With these comparisons, you can obtain a history average by part number.
Then, using some subjective knowledge of your production process — and your purchase arena — determine the most accurate estimated lead time for each part number and load to your ERP database.
Once you have determined the lead time, you will need to convert it to the same time value as the forecast period. For example, if the lead time is 20 days and the forecasting interval is one month, adjust the lead time for this ratio.
The Safety Stock can now be mathematically calculated based on an understanding of the variability of Demand, the stated desired service level and the known lead time of the item.
This value would then be loaded to your 1.4.1 Item Master Maintenance menu, 1.4.7 Item Planning Maintenance menu or 1.4.17 Item-Site Planning Maintenance menu so that the MRP explosions of 23.1 – Net Change Materials Plan, 23.2 – Regenerate Materials Plan, 23.3 – Selective Materials Plan can be netted against that value.
Don Lindsey, CFPIM, CIRM is a knowledgeable Implementation Project Manager, Trainer and Business Analyst for all areas of QAD. He has been an implementation manager on several large, complex MFG/PRO projects, and has worked with the QAD system since 2007 in Manufacturing, Systems Management, Service & Support, and Finance. Don has a diversified background in a wide variety of manufacturing industries from Medical to Electronics to Industrial to Consumer Products. He has spoken for many years at the APICS Conferences, having taught in the APIC Certification program at California State University @ Fullerton for more than 20 years.
Need a better understanding of MRP or training for your staff? Don is available for training and consultation. You can reach him at dhl@32soft.com
Find out more about Safety Stock and MRP
Now that you know the formula for Safety Stock, find out more about how Safety Stock interacts with MRP in this webinar, The Extraordinary Value of MRP.
Learn how you can proactively manage safety stock levels in QAD to achieve the results you need with our Safety Stock Excel Data Loader.