 Why We Added New Graphical Views to Our Production Planner Data Loaders
We’ve all done it. We’ve poured through our QAD production schedule details to make sure there are no glitches, no overlaps, no conflicts or resource shortages only to find we missed a critical element! Even when we download those details to a spreadsheet to sort, filter, slice and dice the data, something can be overlooked and cause production inefficiencies.
Why? Well, because we’re all fallible, of course. But, also because it is mind-numbing work. And, the information is presented in a way that makes it hard to see the patterns, let alone the problems waiting to happen.
And, that is why the concept of data visualization gets so much play these days. Data visualization refers to anything that helps people understand data and its significance by putting it in a visual context. Charts or graphs that illustrate complex data are more comfortable for the human brain to process than spreadsheets or reports. The trends and patterns that can be missed in more text-based presentations can be recognized easily within a more graphical portrayal.
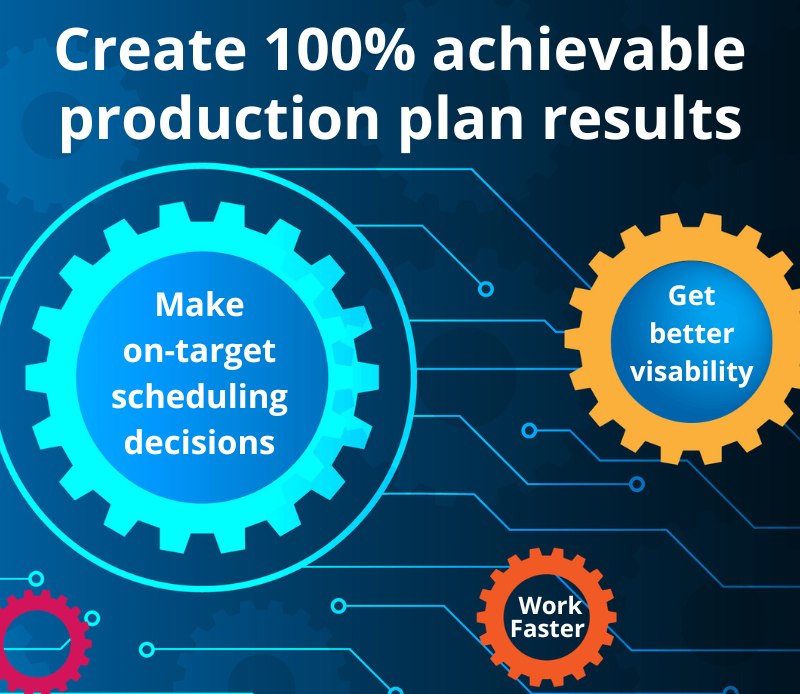
This is precisely why we have added new graphical views to our new Production Planner Plus Data Loaders—so you can have options about how to view your QAD data for better planning and control. You can view the production schedule in graph format to better understand what’s happening on the shop floor. You’ll see at a glance if there are scheduling conflicts or resource shortages. You can reschedule projects to different days/times right in the graph and upload those changes to QAD. And, with calendar and capacity views, you’ll get instant insight into your resources and capacity.
Discover all the ways our new graphical formats can help you keep better control of your production schedule, inventory and resources by watching this webinar replay.