


We publish below Progress 4GL reports for QAD ERP, which have been adjusted to fully utilize 32printer and LBOX MS Excel output capabilities. (Click here to learn more about 32printer and LBOX).
Since not all QAD report layouts are fully suitable for MS Excel output, we have adjusted report’s layouts only leaving business logic intact. Here is how 32printer and LBOX convert reports to MS Excel Spreadsheet.
Download and install report source codes to your TEST system first. Make sure that report versions are compatible with your QAD system version. If not, simply adjust your system reports layouts to conform the described requirement above.
Table of Contents
| Open Sales Orders Report Suppliers Spending Report Fixed Asset Report 23.14 MRP Summary Report 23.17 MRP Detail Report 1.18 Customer Item Report 7.5.13 Req Ship Schedule Summary Report 5.13.10 Unvouchered Receipts as of Date 13.8.13 Where-Used Inquiry 13.6 Product Structure Inquiry 13.12.4 Product Structure Cost Report 27.18 AR Aging as of Effective Date 25.15.5 Trial Balance Detail 15.7.14 Where-Used Report |
Open Sales Orders ReportThis is multi-purpose Excel report, design to help processing Sales Orders on-time and provide valuable statistics at any given point of time, such as what is shippable what is not shippable how many shortages do we have, full details and executive summary. The report generates 3 tab Excel Workbook, the first one has full details, conditionally colored data set for better visibility, so operators who are processing orders should pay attention to a specifically colored lines. Also it shows decreasing Quantity On Hand – how stock was allocated. The second tab has summary, what is shippable what is not, by product item number. The third tab explodes missing components and lists summary by component item number, sorted by descending dollar value of sales.
Report Prompt, looks like this. ┌──────────────────────────────────────────────────────────────────────────────┐ │ Site: To: │ │ Sales Order: To: │ │ Order Date: / / To: / / │ │ Due Date: / / To: / / │ │ Required Date: / / To: / / │ │ Customer: To: │ │ Ship-to: To: │ │ Salespsn: To: │ │ Product Line: To: │ │ Channel: To: │ │ Site List: 2600 │ │ Order Types: Confirmed [V] │ │ Including RMA: yes │ └──────────────────────────────────────────────────────────────────────────────┘ To download report source code click here. The archive has an Excel template file so_report.xls, which should be placed to $32prn/xlt directory. When report is being prepared, 32printer executes VBA macros which are located in the template. |
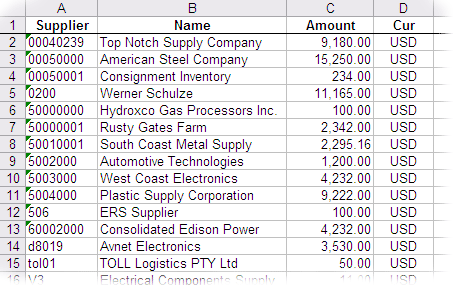
Suppliers Spending ReportIn Accounts Payable it is often important to rate suppliers, in order to get the better understanding of their spending habits. It could be a good business practice to rate the suppliers, based on the amount spent during the fiscal year. The old by proven 80 / 20 rule will apply in most cases, which means that 20 percent of suppliers provide 80% of purchases. At the same time it is imperative to identify the occasional vendors, who provide goods and services from time to time, or none. Most likely, you will want to analyze the reasons of such behavior and as a result to find alternative suppliers. But how can we spot these bottom-ranking players? +------------------------------------------------------------------------------+ ¦* ============= Suppliers Spending Report ========== *¦ ¦* Calculates the total amount spent by the supplier *¦ ¦* during the period of time (based on checks issued). *¦ ¦* Amounts are in Base Currency, using Transaction Exchange Rate *¦ ¦ ¦ ¦ Supplier: To: ¦ ¦ Date: / / To: / / ¦ ¦ Entity: To: ¦ ¦ ¦ ¦ Output: 32prn ¦ ¦ Batch ID: ¦ +------------------------------------------------------------------------------+ By bringing this information to excel spreadsheet, you will be able to analyze it, select 32prn output or LBOX excel printer.
Click here to download report source code, feel free to add more statistics for each supplier. |
Fixed Asset ReportAsset Depreciation report in the convenient Pivot Table format, has lots of FA details such as CLASS, BOOK, BASSIS AMT, METHOD, LIFE, RETIRED, ENTITY, SVS DATE , LOCATION, PERIODIC ACC ACCOUNT, CC, ASSET ACC ACCOUNT, CC, ASSET SUSPENCE ACCOUNT, TAG, etc. As well as detailed depreciation amounts by period. xxfadarp.p b+ 50.10.1 Fixed Asset Report 08/05/09 +------------------------------------------------------------------------------+ ¦ Asset: FA0000100 To: FA0000155 ¦ ¦ Book: To: ¦ ¦ Summary: No ¦ ¦ Include Retired Assets: No ¦ ¦ Depreciation: Period Accumulated/Period ¦ ¦ Output: 32prn ¦ ¦ Batch ID: ¦ +------------------------------------------------------------------------------+
Click here to download report source code, feel free to adjust. A couple of columns in the excel with GL Account numbers will display values as numbers instead of text, please add the following lines to columns.ini file which is in $32prn directory: PERIODIC ACC ACCOUNT ASSET* |
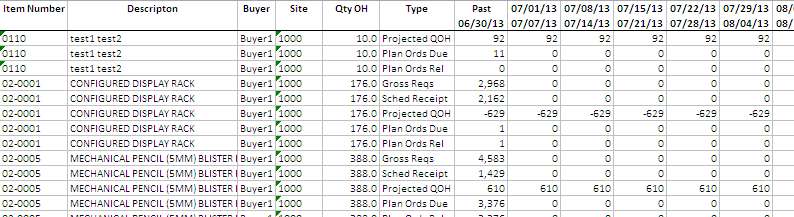
23.14 MRP Summary Report
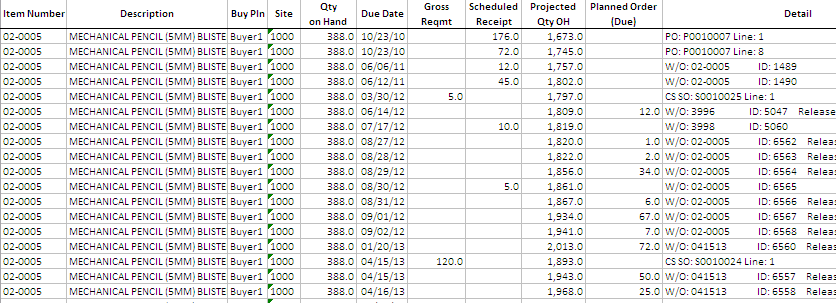
23.17 MRP Detail Report
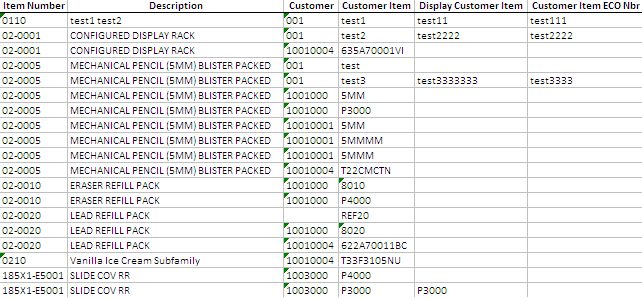
1.18 Customer Item Report
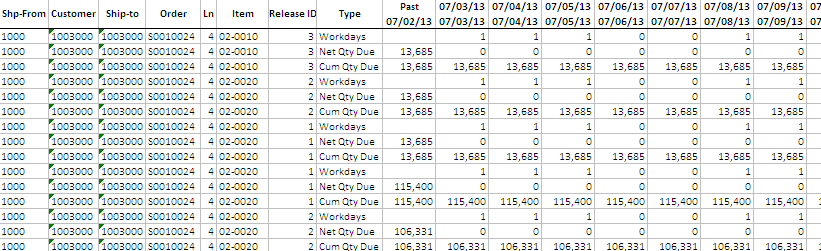
7.5.13 Req Ship Schedule Summary Report
5.13.10 Unvouchered Receipts as of Date
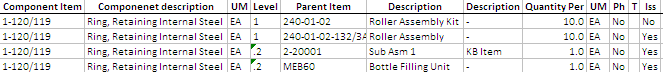
13.8.13 Where-Used Inquiry
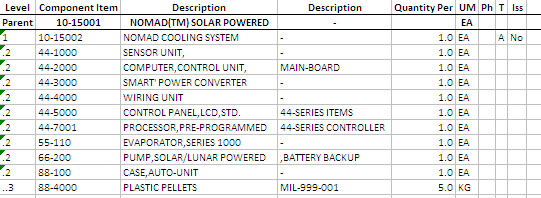
13.6 Product Structure Inquiry
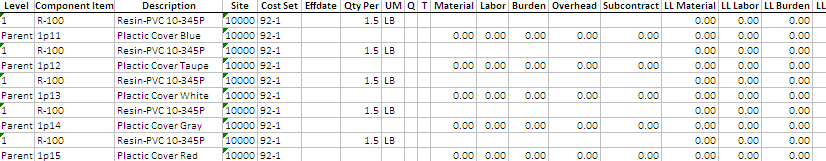
13.12.4 Product Structure Cost Report
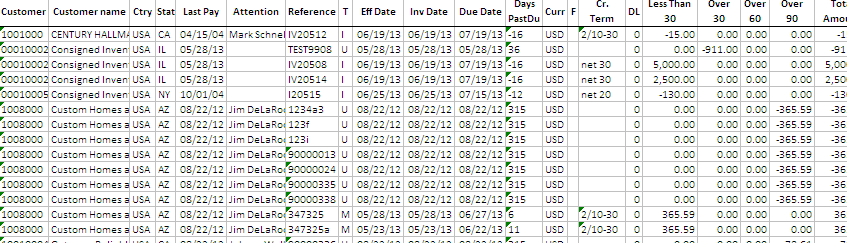
27.18 AR Aging as of Effective Date
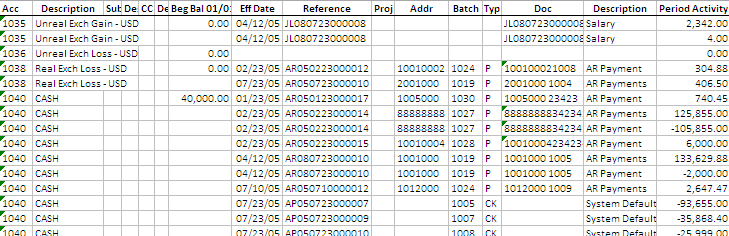
25.15.5 Trial Balance Detail
15.7.14 Where-Used Report
|